If you participate in forums or community discussions with other tech nerds, you’ve likely seen or said something to this effect in response to someone who’s deciding how to setup their homelab, “Proxmox is a hypervisor first and storage system second, while TrueNAS Scale is a storage system first and hypervisor second.”
This is solid advice to give anyone, but it got me thinking – if your needs don’t include the ability to migrate VMs between cluster nodes, how well do virtual machines running on TrueNAS Scale compare to running them on Proxmox?
To find the answer to this question, I tested virtual machines on two identical systems (ok, nearly identical – I’ll explain the minor hardware difference, below) and put them through a series of multi-threaded benchmarks. All tests were repeated with CPU configurations of 1 – 4 cores.
In the battle of VM performance – how do you think the results turned out? Did Proxmox walk away with an easy win? Did TrueNAS pull off an upset? Were the results close?
Table of Contents
Proxmox vs TrueNAS Scale
Before we get to the benchmark results, a bit of background on both server solutions for anyone reading who might not be fully familiar with either.
Proxmox VE
Proxmox Virtual Environment (VE) is a free and open-source virtualization platform based on Debian Linux that allows you to manage virtual machines, containers, and storage. The platform includes its own hypervisor that is built on KVM (Kernel-based Virtual Machine) and also supports the management of Linux Containers (LXC), making it a versatile solution for virtualization needs. Additionally, it integrates with various storage technologies such as Ceph, GlusterFS, and NFS, and supports live migration of virtual machines between nodes for high availability. Overall, Proxmox VE is a powerful and flexible virtualization platform that is well-suited for small to medium-sized businesses, as well as homelab and testing environments.
TrueNAS Scale
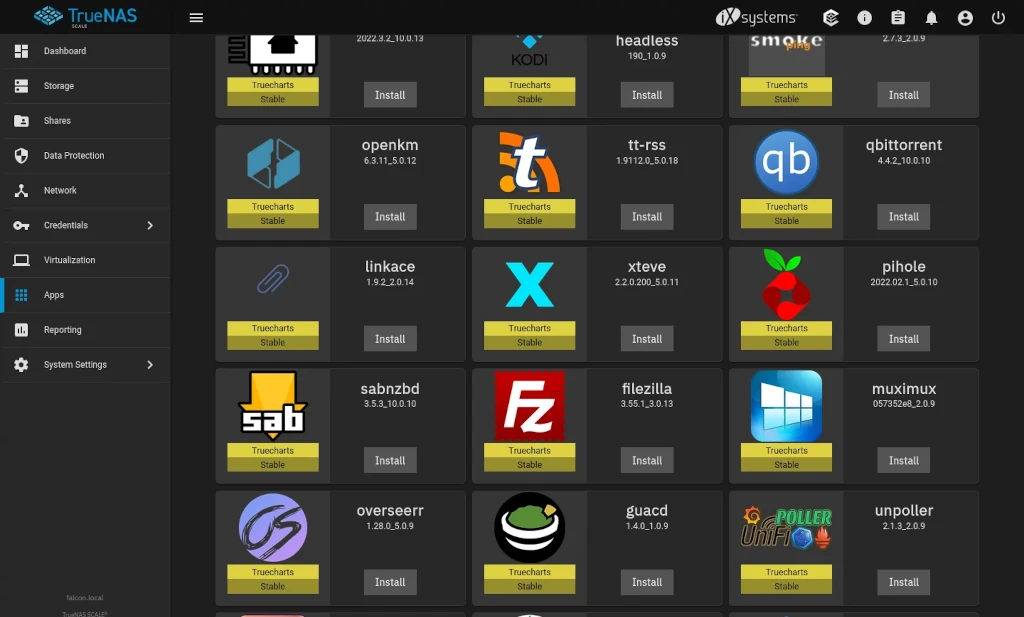
TrueNAS Scale is a scalable storage and virtualization platform developed by iXsystems. It, too, is built on Debian Linux and leverages KVM virtualization technology for running virtual machines. In addition to virtual machines, It also supports the deployment of applications as Docker containers. With TrueNAS Scale, it’s possible to easily manage both storage and virtualization from a single device.
Testing Setup
Next, let’s have a look at the setup that was used for testing. I mentioned, above, there was a minor difference in the hardware between the two systems. You’ll notice that the Proxmox system is using a ZFS mirror with two SSDs for VM storage, while the TrueNAS Scale system is using three SSDs in a RAIDZ configuration.
These devices were initially setup for specific purposes in my homelab when I decided to run these tests before actual workloads were deployed to them. I decided against reconfiguring the TrueNAS system storage because I felt it shouldn’t affect the test results in any meaningful way.
Host System
| Proxmox | Virtual Environment 7.3-4 |
| TrueNAS | Scale 22.12 |
| CPU | Intel i5-6500T – 4 Cores / 4 Threads |
| Memory | 16GB Dual Channel – 2x 8GB SK Hynix DDR4-2133MT/s (affiliate) |
| Swap | Enabled |
| Boot Disk | TeamGroup MP33 NVMe SSD (affiliate) |
| VM Storage | ZFS Mirror / ZFS RAIDZ |
| VM Disks | Crucial MX500 SATA SSD (affiliate) |
VM Configuration
| VM OS | Debian 11 / Kernel 5.10.0-21-amd64 |
| CPU Cores | 1 – 4 Cores Tested |
| CPU Type | Host / Host Passthrough |
| Memory | 4GB |
| Swap | None |
As previously mentioned, the virtual machines were tested with single core through quad core configurations. Please note that the host systems, themselves, have quad core CPUs. Results from the quad core testing should be examined with this in mind as the host system will require some amount of resources for itself to operate.
Additionally, the CPU type for the virtual machines on both systems were configured to host / host-passthrough to ensure as like-for-like a comparison as possible. I recently published a tutorial on why this setting is important for VM performance, if you’re not familiar with it.
Test Results
In an effort to account for the liklihood of test variance, each benchmark was run three times per configuration. Each of those runs included a minimum of three test passes. The passes from each run were averaged together and the individual runs were then averaged together to produce a final result.
Now that we have all of the pertinent details covered, let’s get to the results.
Sysbench Memory
The Sysbench memory test isn’t simply a benchmark of memory bandwidth. Factors such as CPU performance, system architecture, and memory latency can affect results. In this comparison, however, all of these factors are the same between the comparison systems. Instead, we’re looking to see whether the underlying hypervisor affects system performance in any way that would influence the results.
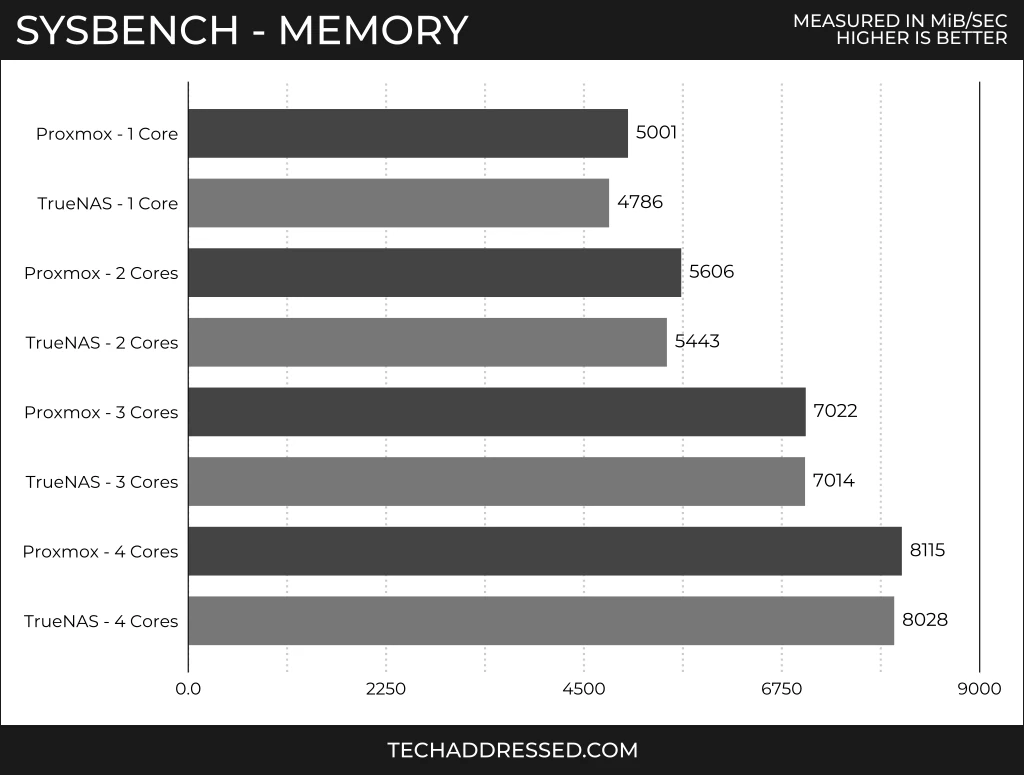
Looking at the results, we have Proxmox scoring 4.9% faster in the single core comparison, with it’s lead dropping considerably when we increase the core count: two cores – 1.4% / three cores – 0.1% / four cores – 1.1%. While I give the technical win here to Proxmox, results this close are difficult to differentiate from test variance. There were a couple runs where TrueNAS came out ahead and a couple others that were neck-and-neck.
To ensure the single core scores were valid, I retested both systems in this configuration and was able to duplicate the results. Apparently, TrueNAS Scale suffers possible memory performance penalties on single core virtual machines. As long as your VM has more than a single core, I consider performance in this workload “almost a tie” – the difference is so small you won’t likely notice.
FFmpeg Encoding
FFmpeg encoding is what I tend to think of as the most real-world comparison I test, as self-hosting media servers is extremely popular for both new and experienced homelabbers. Both of our comparison solutions are popular choices for this task.
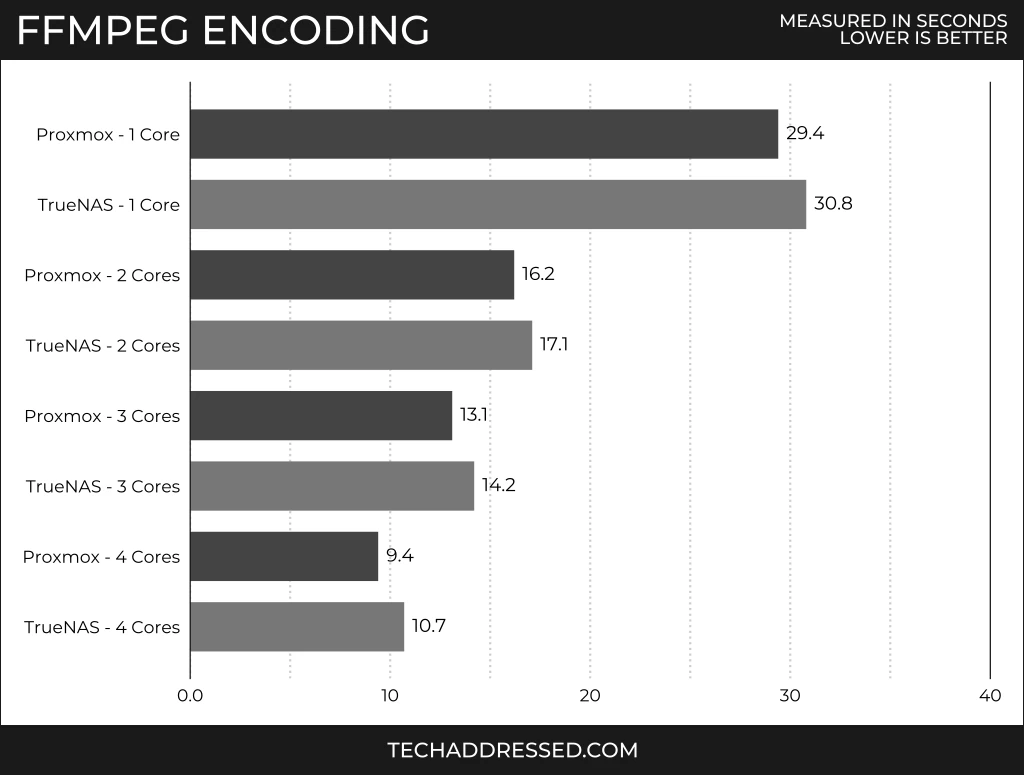
I honestly didn’t expect there to be any tests in this comparison with this big of a blow-out win. Proxmox wins with a single core difference of 4.5% that just keeps growing as you continue adding cores: two cores – 5.4% / three cores – 8.2% / four cores – a massive 12.6%!
Even if we consider the possibility that the four core result might have been a narrower margin on a host with additional cores, given how the scores increased between the other configurations, I don’t think it likely the difference would be particularly large.
7-Zip Compression / Decompression
Some interesting trends began to appear when I analyzed the results of the 7-zip tests. Much like we saw with the Sysbench memory test, performance was particularly poor in the single core comparison. However, with additional cores, the performance difference starts to shrink.
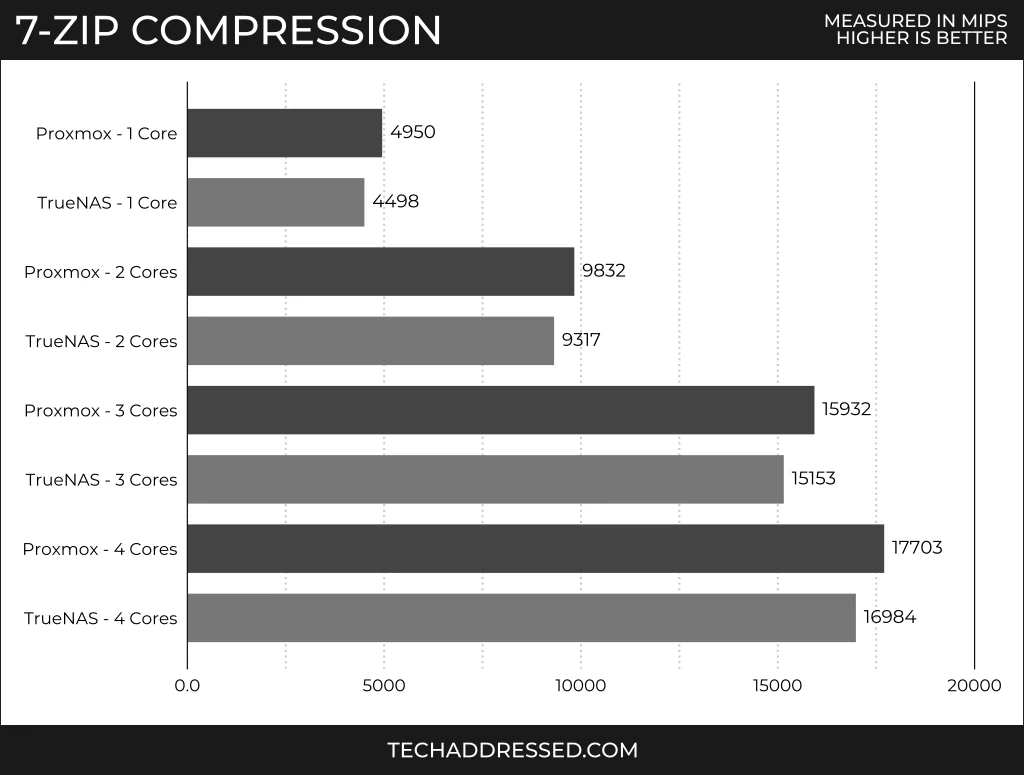
The single core results show Proxmox winning by 9.1%. Once we add additional cores the performance difference drops by roughly half: two cores – 5.3% / three cores – 4.9% / four cores – 4.1%.
As I analyzed the data, I found it interesting that, much like the Sysbench results, the multi-core scores fall within the range of test variance with each other. It would be fair to say that so long as your VM has multiple cores – and for this kind of workload it should – Proxmox will outperform TrueNAS by roughly 4.7% +/- 0.6%.
I can’t say with certainty that this similarity is due to the same factors that resulted in the Sysbench memory results, however, the 7-zip compression test is sensitive to overall memory performance.
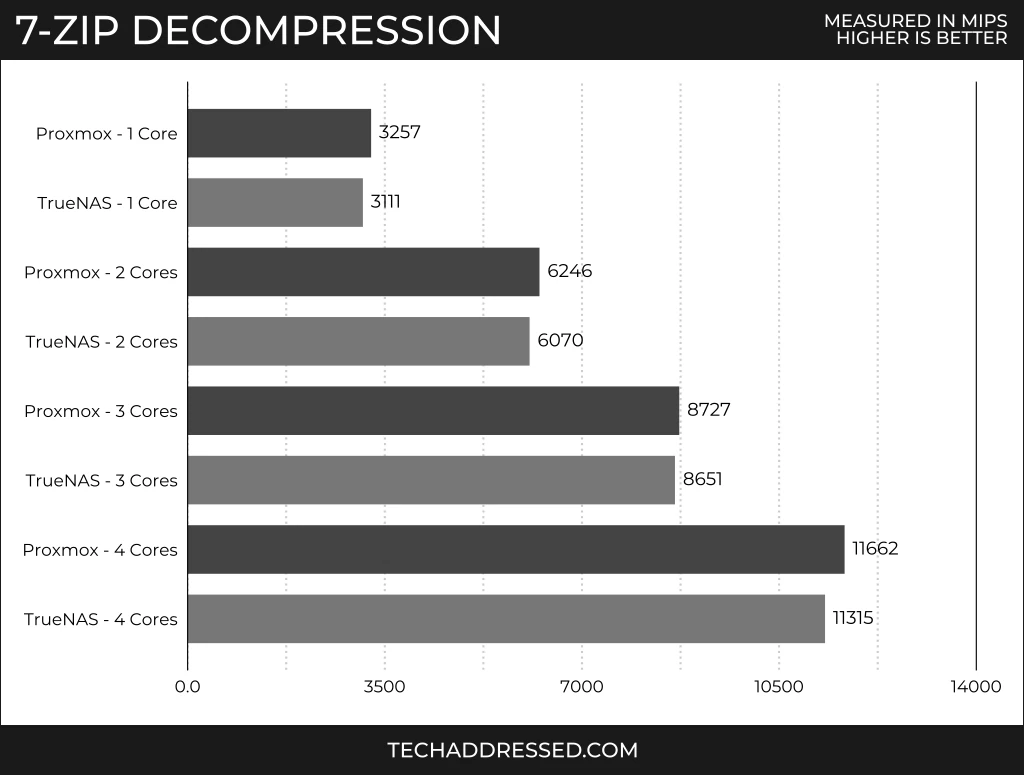
In the decompression test, single core performance was, once again, particularly poor for TrueNAS with Proxmox ahead by 4.5%. Once again, adding additional cores reduces the deficit: two cores – 2.8% / three cores – 0.9% / four cores – 3.0%.
Here, I noticed that, like the Sysbench test, the three core results are so close that they could be explained by testing variance. We see the four core score worsen when compared to three cores, again, though I think this is likely due to the host only having four cores. Testing variance alone wouldn’t account for that large of a difference to the three core results.
Much like I did with Sysbench, I’m willing to consider performance in this workload “almost a tie”, in situations where you’ve configured sufficient cores to the VM.
Linux Kernel Compilation
I use the Linux kernel compilation benchmark for testing a highly compute intensive workload – one that stresses most aspects of a computer system. I mentioned, previously, some trends appearing in the 7-zip results. Upon analyzing these test results, I think we clearly see a pattern forming.
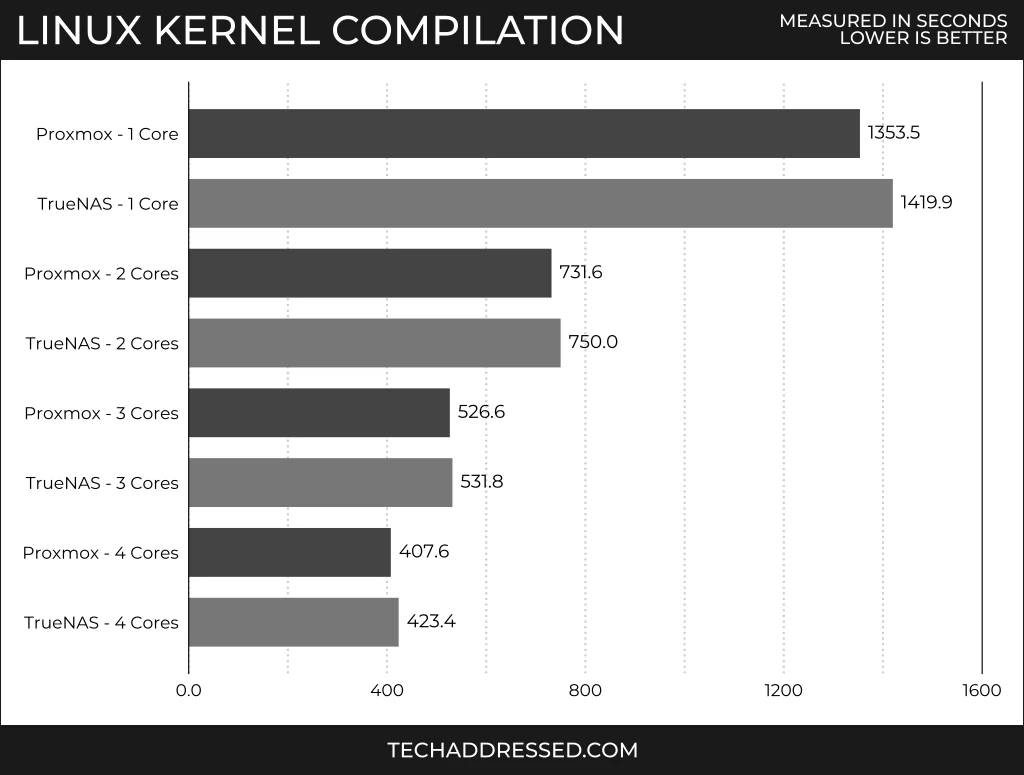
If you guessed that TrueNAS has a particularly poor showing with a single CPU core – you’d be right! Here, we have the single core VM losing by 4.6% – almost identical to the 7-zip decompression result. Additional cores lower the difference in much the same way: two cores – 2.4% / three cores – 0.9% / four cores – 3.7%.
Once again, I suspect that the additional difference in the four core results are attributable to overhead caused by the hypervisor because the host device only has four cores.
General Conclusions
After considering the data I’ve collected, there are a few conclusions that I think are fair to make – largely reinforcing the premise that this review was intended to examine.
Storage Is Your Primary Requirement
If you’re setting up a homelab or small business server and the following is true:
- Your primary requirement is setting up reliable storage
- You don’t have an additional system for virtualization tasks
Choose TrueNAS Scale, as it’s the superior storage platform and your virtual machines on top of it should work well enough. While TrueNAS Scale imposes some amount of additional overhead on a host compared to Proxmox, I don’t think the performance difference is significant enough that it would be a problem in this situation.
All Other Scenearios
If you’re deciding between using Proxmox and TrueNAS Scale and storage is NOT the primary task for the system, you’re always going to be better off selecting Proxmox. Even though the performance difference in many situations is negligible, there isn’t any compelling reason to choose TrueNAS in this situation.
Closing
If you guessed that Proxmox would come out on top, you guessed right. How did the results compare with your expectations, overall? Sound off in the comment section, below. I’d love to hear your thoughts on this comparison.
Honestly, in the end, TrueNAS Scale scored better than I expected it would. I thought the scores would more closely resemble the single core results across the board for all core counts. Perhaps with additional updates to the software, iXsystems will be able to narrow the performance gap even further. Given some time, I’ll likely revisit this comparison to see if there’s been any improvements.
If you found this article helpful and would like to support our efforts to create additional resources like this, please consider making a donation. Your support is greatly appreciated!
If you can’t make a donation, please consider sharing this review with others who may be interested. If you have questions about anything regarding this review, please be sure to leave them in the comments below. Thanks for reading, and I hope you visit again soon!


I needed this one! I currently have a TrueNas as a VM on my Minisforum ms-01 on Proxmox 8. I have passed through two m.2 slots as well as a qnap QXP-400eS-A1164 connected to TL-D400S for additional pools. I was contemplating to move to native TrueNas but i think its abilities to control the device pass through as well as network management shows your point on it being Storage first.